


A software program may crash unexpectedly due to bugs or errors in the code. Hence, debugging stops unanticipated crashes or improper execution of software or system. Finding and fixing bugs, flaws, or errors in software code is known as debugging. It helps you manage and thoroughly investigate the general operating configuration of your system or the third-party software installed on your PC. Debugging is more difficult when several modules or subsystems are tightly coupled since changes to one subsystem or module may introduce other bugs. Debuggers and other debugging tools are now available to assist you. One may easily debug Windows apps (in user mode), the entire operating system (in Kernel mode), and drivers using the best debugging software. Thankfully, there is a variety of debugging software accessible for Windows PC. This detailed guide helps you select the best debugging tool for your Windows PC while considering all the variables.
Great Debugging Tools For Windows
The best debugging tools for Windows 10 and 11 are included in this area. Choose the best option for you!
1. Immunity Debugger
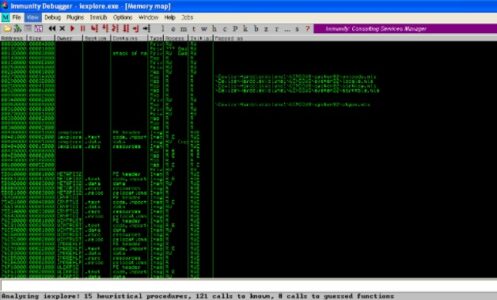

Immunity Debugger is a powerful tool for analyzing malware and reverse-engineering binary files, living up to its name. It has a simple user interface designed using direct heap analysis methodology and tools. In addition, this debugger takes advantage of a fantastic scripting language to automate the whole intelligent debugging process. The debugger can also reduce the time it takes to construct an exploit by as much as 50%. It is, without a doubt, one of the promising debugging tools for Windows PC that enables quick debugging to halt corruption during the in-depth investigation. The cherry on top is that it is available for free download.
2. Syser Debugger
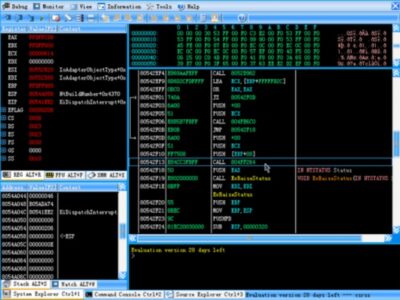

Syser Debugger, a free debugging tool, is the best debugging tool for Windows PC. An X86 kernel-level program with 32 bits is this debugger. At any point in time, it can track every Windows operating system instruction. C/C++ source code debugging and color disassembly are compatible with this debugging utility. Syser also works as a Windows driver developer. Without any difficulties, it can operate several virtual engines, including VMware.
3. Zend Studio Debugger
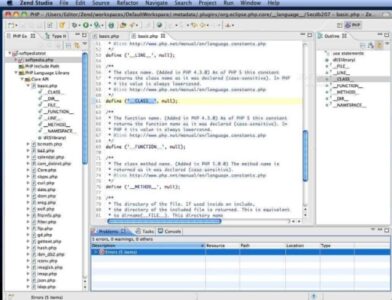

Zen Studio Debugger is the next item in our list of the best debugging tools. It is a clever tool that helps you completely evaluate codes and provides a wide range of features that make code development hassle-free for code developers. Via its excellent code assistance, its sophisticated editing saves enough time. Thanks to the debugger for Windows’ very sophisticated features, the PHP apps may be deployed on any server. GitFlow, Docker, and Eclipse plugins are just a few of the utilities you may use with this debugger.
4. Visual Studio Debugger
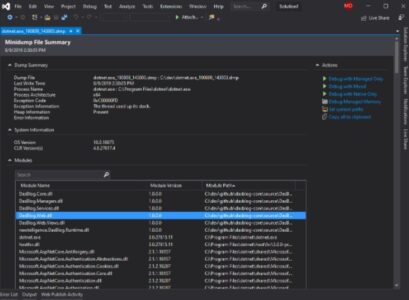

It is a potent piece of software offering a collection of project design and debugging tools to help you find and fix bugs quickly and easily. With its thorough code analysis, unit tests, and separate design output processes, this debugger utility is the best approach to detecting bugs or errors in your software code. The developer can also write code in many languages using Microsoft Studio. You may also change the UI based on your preferences.
5. WinDbg
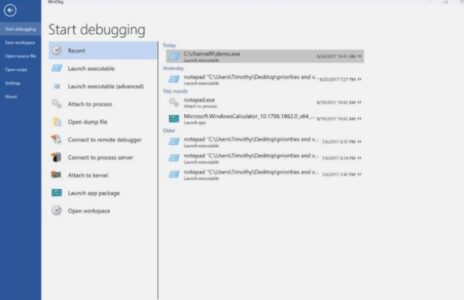

WinDbg is a fully free debugging tool for Windows PC. It is a multifunctional utility tool that is designed with all the tools required for debugging user-mode apps, the operating system as a whole, and the drivers. Microsoft created and designed WinDbg, which requires two linked PCs to function at their best. Bugs, flaws, or errors may be easily, rapidly located and fixed with this debugging software.
6. OllyDbg
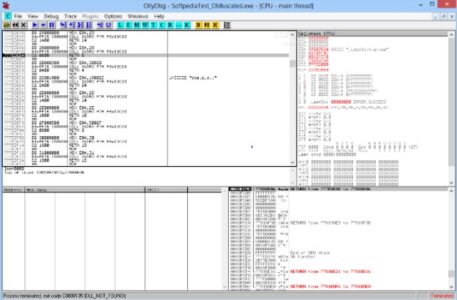

It is a debugging tool that streamlines and speeds up the entire process of debugging a software function by automating each step. Based on reverse engineering methods, this software breaks whole systems and installs third-party apps on PCs. For DLL debugging, file scanning, software cracking, code analysis, malware & virus analysis, and many more tasks, OllyDbg is a well-known program. It is free software that automatically detects the content of registers, recognizes procedures, tables, constants, and API calls, tracks routines from object libraries and files, and records strings.
7. IDA Pro
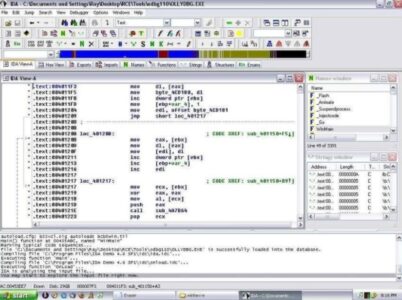

IDA Pro is an excellent multi-processor debugger utility tool for Windows, Linux, and Mac operating systems. This debugging tool helps program developers detect and fix common errors or bugs. It can debug a wide range of platforms, including iOS and Android. The ability to do local and remote operations is one of the best features of using the IDA Pro debugger.
8. GNU Debugger
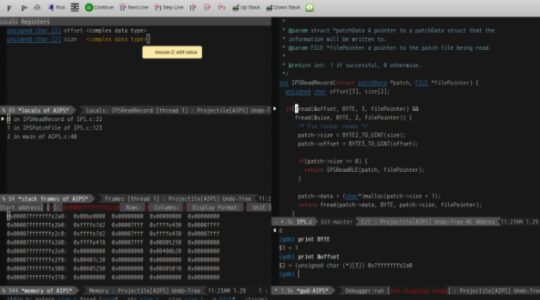

You may learn what happens within the programs during execution using the widely used utility tool GNU Debugger. To detect what took place inside the program to cause it to crash unexpectedly, the GNU Project Debugger offers helpful tools. The most intriguing aspect is that it is portable debugging software that functions on various Unix-like systems without a hitch. Also, it is compatible with the most popular programming languages, such as Free Pascal, Fortran, Go C, C++, and many others. It is the best portable debugging tool you can think of.
9. ReSharper

It is a popular debugging tool used as a VS plugin (Visual Studio). ReShaper may be used to build and manage code by teams and individual .NET developers. It has a powerful unit test runner that offers complete support for various code templates. In addition, ReShaper offers thousands of quick and easy changes to cure errors automatically and enhance the code. More than 60 refactorings and 450+ contexts safely structure and transfer code across the solution. Use this debugging tool because it offers everything you need to write code.
Conclusion:
These are some of the best debugging software for Windows PC. Your local and remote debugging experiences are hassle-free, thanks to the tools. For a far better debugging experience, we recommend trying Immunity Debugger. Do you have any other or better ideas? Then, let us know in the comments section below.