


Any application must have monitoring as an essential part. The AWS monitoring tools that you may integrate with your AWS account are covered in this article. The world of IT has been completely overtaken by cloud computing. The conventional system of internal servers has been replaced by virtual infrastructure in our cloud-based platforms. There are very few problem statements that the cloud cannot answer in terms of applications that we use our cloud providers for. The cloud is an obvious and important solution for most modern applications due to its scalability, usability, and availability.
The top cloud service provider worldwide is AWS. It provides more than 200 services and holds a sizable portion of the cloud industry. Numerous MNCs and startups rely on AWS as their cloud provider. The requirement for monitoring our services in our account originates from the AWS Cloud platform’s extremely high demand. Shared responsibility is a model used by AWS. While some AWS services are handled automatically, others require user intervention. There may be scenarios in which the hardware of your service breaks or your application crashes, even though AWS did its part to the utmost. A monitoring system should be in place for all these scenarios and potential crashes.
Well, monitoring your AWS resources is one of the finest methods to ensure that your resource (or your application) is operating at its best. Most of the AWS certification tests cover monitoring extensively. AWS is aware of the value of monitoring and why having an effective monitoring system for applications may be essential. It is intended for more than just application and system failures. Based on your monitoring data can also assist you in making important modifications to your application architecture.
The Best AWS Monitoring Tools You Can Try
We’ve compiled a list of AWS Monitoring Tools to help you find the right one.
1. Splunk
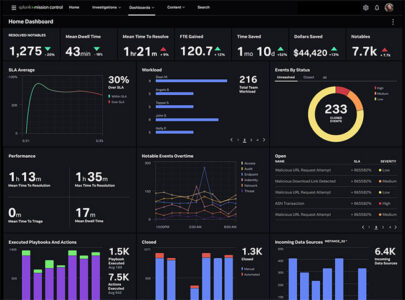

For application monitoring, Splunk is a well-known software brand with a large user base. It enables us to monitor AWS changes and stop unusual or unauthorized behavior. A simple, uniform dashboard contains all of this information. In addition, Splunk can ingest your CloudWatch logs for archival reasons. Splunk is a fantastic AWS monitoring tool, although it works best for large businesses.
2. AWS CloudWatch


The fundamental and important service provided by AWS is CloudWatch. CloudWatch is free to use for the most part, although it does include certain in-depth monitoring features for which you may need to pay. It is an AWS native tool that gives you useful information about the services available through your AWS account. Your AWS ClooudWatch’s CloudWatch Alarms are one of its most important features.
We can set alarms for CloudWatch’s metrics. For instance, you may set an alarm for an EC2 instance’s CPU use. As a result, the alarm now sounds anytime your instance’s CPU Utilization exceeds a specified threshold. This alarm may also be integrated with several services to automatically alert the account user or repair the application environment.
The CloudWatch Logs dashboard is part of CloudWatch. Your AWS services’ log archive may be seen here. Most AWS Services may be readily set to transmit logs to the CloudWatch Logs or are automatically linked with AWS CloudWatch. Installing and configuring the CloudWatch agent allows us to set up CloudWatch to interact with our on-premise servers easily.
3. SolarWinds
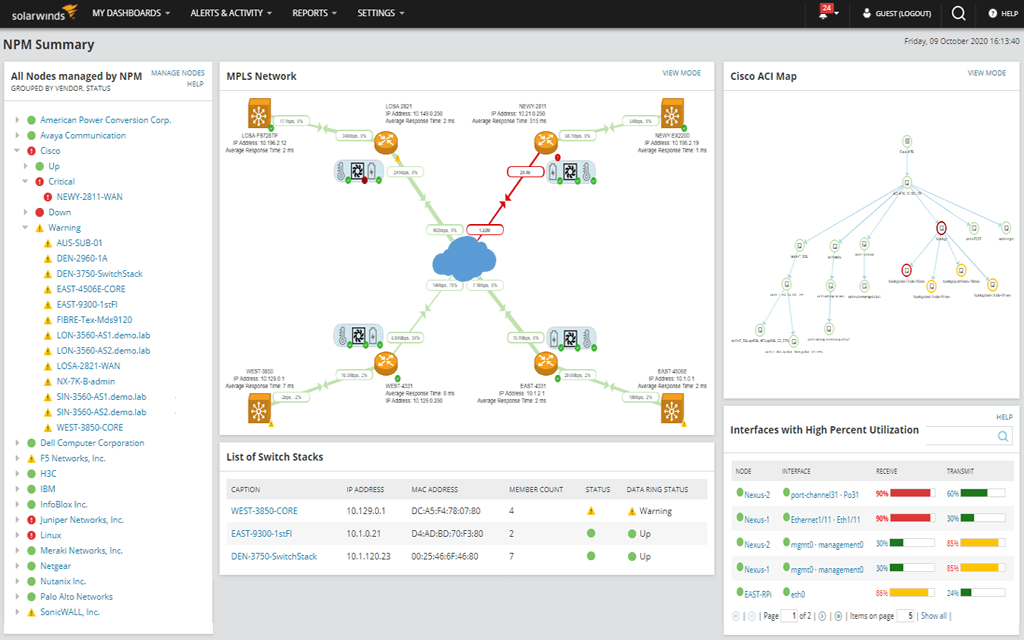

An application made specifically for monitoring servers is called Solarwinds Server and Application Monitor. It has several AWS Cloud-specific features. The tool begins tracking your AWS account’s metrics when it detects changes (such as a new EC2 instance). Additionally, it may be used with on-site servers. Since SolarWinds is a rather technical platform, non-tech users can find it challenging to understand.
4. CAST AI

For cloud-native companies, CAST AI enables engineers to fully automate Kubernetes and reduce cloud expenditures by an average of 65%. The platform was developed to help DevOps teams save time, eliminate manual processes, and have complete insight into the price and security of their Kubernetes deployments. Full automation features, including autoscaling, bin packing, spot instance automation, free cost monitoring, and security insights, are included with the platform. See how much you can save by connecting your cluster to CAST AI. Explore the various cost and savings data, then onboard the cluster and set up the Autoscaler rules to manage the cluster. It only takes a few minutes to cost- and performance-optimize your cluster. Little technical expertise is needed to use the product since CAST AI abstracts layers of technological complexity from the user.
5. Nagios
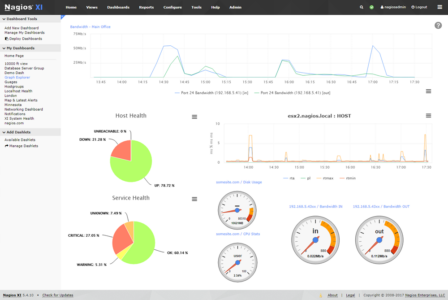

Nagios XI is an open source AWS monitoring tool and on-prem servers. The dashboard provides thorough updates on the server data, which helps reduce the total troubleshooting time. In addition, the tool creates notifications for any odd activity in your account. Nagios is a less expensive AWS monitoring tool, but most of its features are quite sophisticated and simple to use.
6. AWS CloudTrail

AWS offers a special service called CloudTrail. In your AWS account, it monitors and records every action. For example, every modification you make to your infrastructure or AWS account is recorded. For instance, you discovered that some IAM roles had been deleted from your account. To see all the information about the deletion operation on these roles, look for the DeleteRole step in the CloudTrail and filter the results. To find out who or what service deleted these roles, when they were deleted, and other details, CloudTrail records every API request.
Third-Party AWS Monitoring Tools
Your use of AWS services may grow as your application expands. This also means the amount of AWS CloudWatch Metrics and Logs will grow. However, finding the proper information in these unprocessed metrics and data can take time and effort. This is where we require third-party applications that can examine our cloud resources, logs, and metrics and offer us useful information.
7. AWS Config
An AWS monitoring tool is called AWS Config. We may use it to construct rules that analyze, audit, and assess how our AWS resources are configured. This means that the AWS Config dashboard does not display metrics or logs. Instead, we may set up certain rules highlighted in the Config console when they are broken. For example, you may set a rule in AWS Config to activate if the SSH port (port 22) is available to the internet (0.0.0.0/0), as is a common example. This rule enables you to impose your control on security groups because it is not recommended to have an SSH port accessible to the internet.
8. Datadog
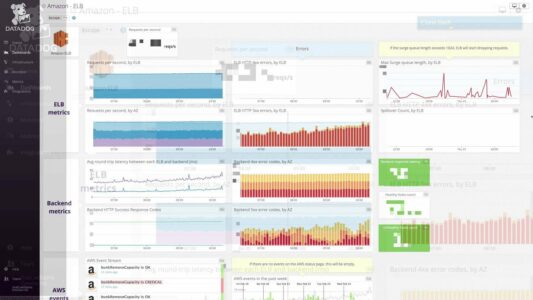
One of the strongest and most complete AWS monitoring tools is, without a doubt, Datadog. It is a SaaS platform for AWS resource monitoring and analytics that enables you to gather data about your application or rapidly filter and analyze logs and metrics for troubleshooting. Officially recognized as an AWS Advanced Technology Partner is Datadog. The platform is subscription-based and offers a 14-day free trial. Datadog provides a single, customizable, and flexible dashboard for all of your AWS monitoring needs. Datadog can effortlessly gather metrics throughout your AWS account’s whole service stack and provide a statistic of this data thanks to its over 350 vendor-supported connectors. By configuring your on-premise servers & applications for Datadog monitoring, you may also use Datadog in a hybrid cloud environment.
9. LogicMonitor
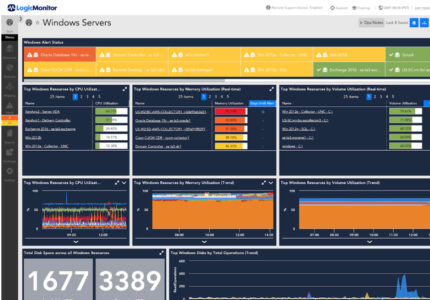

We now have a centralized platform for all of our AWS Metrics thanks to the cloud-based platform LogicMonitor. Your AWS account and applications may be monitored with a straightforward three-step setup. For rapid troubleshooting, it leverages improved visuals and gives instant exposure to metrics, logs, and resources. For our multi-cloud applications, LogicMonitor can smoothly integrate with several cloud platforms, including GCP, Azure, and AWS. Our on-premises servers may be monitored using the tool as well.
10. Paessler PRTG
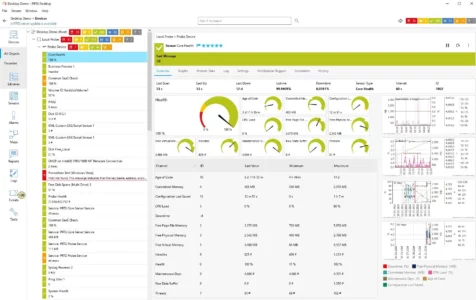

Paessler A common AWS monitoring tool is PRTG. It collects AWS CloudWatch metrics from AWS using service sensors to provide you with performance information. By assisting you in avoiding many issues completely, PRTG seeks to reduce the time spent debugging your AWS applications. With the help of pre-configured sensors in PRTG, you may collect data from AWS CloudWatch for several AWS Services. Additionally, these sensors may be modified to meet specific needs and are very customizable. We may use PRTG for free if we require fewer than 100 sensors after the one-month trial period.
11. New Relic
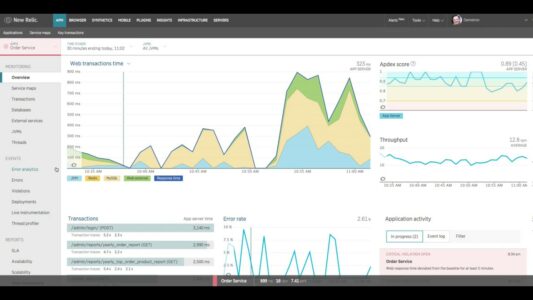
An AWS Advanced Technology Partner monitoring service is New Relic. To view everything that occurs in our AWS Account in real time, we may use New Relic. To identify bottleneck performance issues and reduce vulnerabilities, Pixie aids in understanding intra-cluster communications. Several AWS Services are integrated with New Relic, giving you a real-time view of metrics and performance problems. It enables you to create personalized dashboards and do “slice and dice” operations on AWS data. In addition, startups participating in the AWS Activate program can use New Relic.
12. ManageEngine: Applications Manager
The cloud monitoring tool created by ManageEngine is called the application manager. It seeks to deliver useful information from unprocessed Cloudwatch data and logs. The Applications Manager may integrate with on-premises (hybrid cloud) and multi-cloud settings for thorough application monitoring. The tool offers a comprehensive picture of the complete infrastructure and pinpoints the crucial problems with AWS resources. Numerous services are supported by ManageEngine: Applications Manager, including EC2, Lambda, AWS billing, RDS databases, and many others. It gives a single picture of the AWS infrastructure and applications by gathering all performance data in the form of metrics and events.
Consider The Following:
The Bottom Line:
Choosing a thorough, effective, and reasonably priced third-party monitoring tool is an important part of the process. Starting with tools that offer a fair trial time or a money-back guarantee is what I advise. In addition, the tool you use should include most AWS services, not the common ones like S3 and EC2. This is another extremely important point to keep in mind. Finally, consider features such as live monitoring and SMS or email notifications, depending on your needs. The list above will assist you in making an educated choice when choosing an AWS monitoring tool.